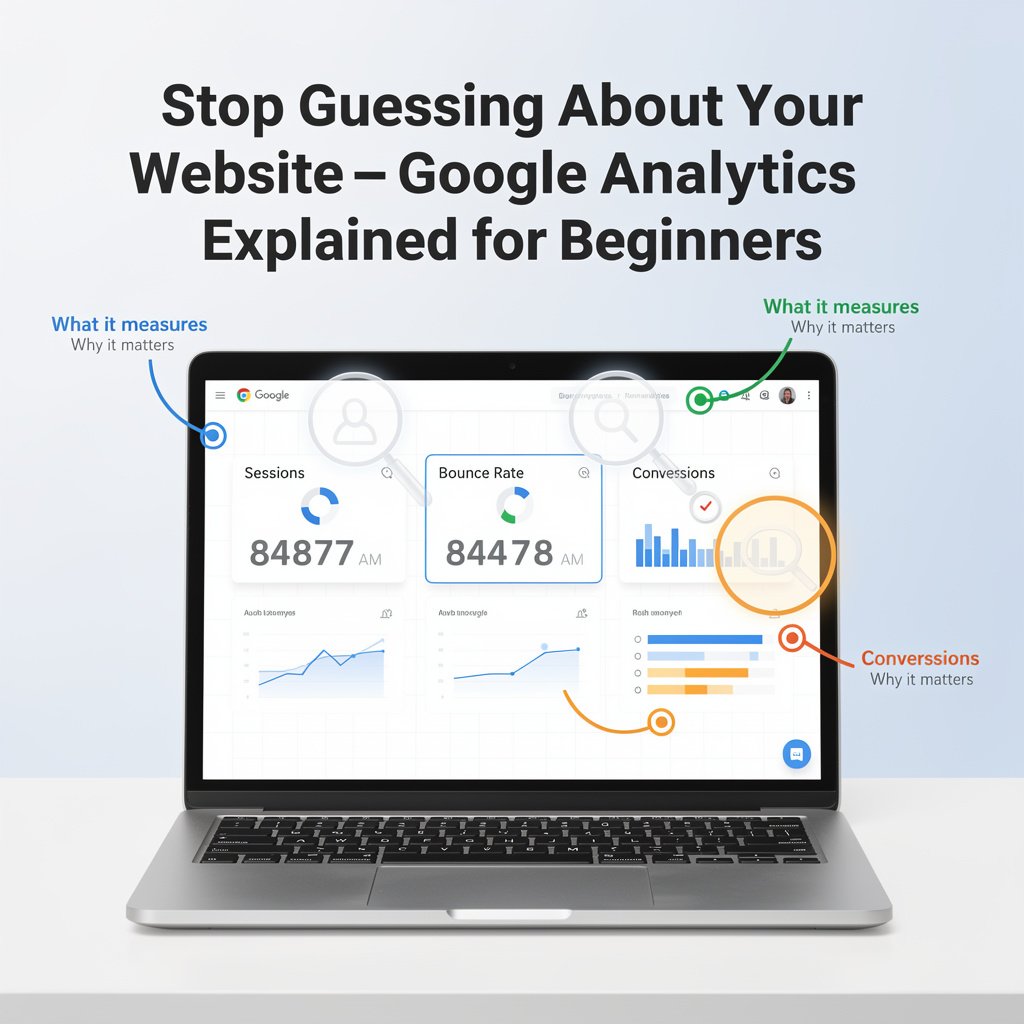
Most website owners have Google Analytics installed but rarely look at it — and when they do, the dashboard presents so much data that it is impossible to know where to start. What does 'bounce rate' actually mean for your specific situation? Is 2 minutes average session duration good or bad? Which report tells you whether your marketing is working?
This guide explains Google Analytics 4 (GA4) in plain language, identifies the reports that matter most, and shows you how to use the data to make better decisions about your website and marketing.
Setting Up Google Analytics 4
Google Analytics 4 (GA4) is Google's current platform, replacing Universal Analytics in 2023. If you have not set it up yet:
Go to analytics.google.com and sign in with your Google account
Click Create Account and follow the setup wizard
Create a Property and select your website URL
Add the GA4 tracking code to your website (via Google Tag Manager for easiest management, or directly in your website header)
Verify data is flowing by checking Realtime report within 24 hours
The 5 Most Important Reports for Small Business Owners
1. Reports > Acquisition > Traffic Acquisition
This is the most important report for marketers. It shows where your visitors are coming from: organic search (Google), social media, email, direct (typed your URL), and referral (other websites). This tells you which marketing channels are actually driving visitors.
Key questions to answer here: Is organic search traffic growing month-over-month? Which social platform sends the most traffic? Is email driving meaningful visits?
2. Reports > Engagement > Pages and Screens
Shows which pages on your website receive the most traffic, how long people spend on each page, and engagement rate. Use this to identify your most popular content (create more of it), your worst-performing content (improve or redirect), and your highest-engagement pages (add calls to action there).
3. Reports > Acquisition > User Acquisition
Similar to Traffic Acquisition but focuses on first-time visitors specifically. Shows which sources bring new visitors to your site — important for understanding where audience growth is coming from.
4. Explore > Funnel Exploration (Conversion Funnel)
If you sell products or collect leads, the funnel exploration shows you exactly where people drop off between arriving at your website and completing a purchase or form submission. If 200 people added to cart but only 20 purchased, the funnel shows exactly where the other 180 left.
5. Reports > Engagement > Events
GA4 tracks user interactions as Events. Scroll depth, video views, button clicks, file downloads — all shown as events. This tells you how visitors actually behave on your website, not just that they visited.
Key Metrics Explained in Plain English
Sessions vs. Users
Users = unique visitors. Sessions = visits (one user can have multiple sessions). If you see 1,000 users and 1,400 sessions, it means some people visited more than once — a positive sign of engaged audience.
Engagement Rate
GA4's replacement for bounce rate. Engagement rate shows the percentage of sessions where the user actively engaged (scrolled, clicked, spent more than 10 seconds, viewed more than one page). A 60-70% engagement rate is healthy for most blogs and content sites.
Average Engagement Time
How long visitors spend actively engaged with your website (not idle in a tab). For blog content, 2-4 minutes suggests people are actually reading. Under 30 seconds suggests content is not meeting visitor expectations.
Conversions
GA4 calls key actions 'conversions.' You define what counts as a conversion for your business: form submission, purchase, phone call click, newsletter signup. Without defined conversions, you are measuring traffic without context.
Setting Up Conversions in GA4
Conversions track the actions that matter for your business. To mark an event as a conversion:
Go to Admin > Data Display > Events
Find the event you want to track as a conversion (e.g., 'generate_lead' for form submissions)
Toggle the 'Mark as Conversion' switch
Conversions will now appear in the Conversions report
For e-commerce businesses, integrating GA4 with your shopping platform (Shopify, WooCommerce) enables automatic revenue tracking, product performance reports, and purchase funnel analysis.
Using Google Analytics to Improve Your SEO
The Pages and Screens report combined with Search Console integration reveals your most powerful SEO opportunities:
Pages with high impressions but low clicks in Search Console: your title and meta description needs improvement
Pages with good traffic but high bounce rate: content does not match what searchers expected
Pages with low traffic and good engagement: they rank low but engage well — worth building more links to
Connect Google Search Console to GA4: Admin > Product Links > Search Console Links. This adds search query data directly into your Analytics reports.
Understanding Traffic Sources
Organic Search
Visitors who found you through Google search without clicking an ad. Growing organic traffic is the primary SEO success metric. Flat or declining organic traffic despite regular publishing suggests keyword, technical, or backlink issues.
Social
Visitors from social media platforms. GA4 automatically categorizes Facebook, Instagram, Twitter, Pinterest, and others. Use this to identify which platforms actually drive meaningful traffic versus just engagement.
Visitors arriving via email links. For this to work correctly, all email campaign links must include UTM parameters: add ?utm_source=email&utm_medium=newsletter&utm_campaign=campaign-name to every link in your email newsletters.
Direct
Visitors who typed your URL directly. High direct traffic indicates strong brand recognition. But direct traffic can also include email visitors if UTM parameters are missing — another reason to always use UTM links.
Setting Up a Monthly Analytics Review
A structured monthly review takes 30 minutes and answers the questions that drive marketing decisions:
Traffic Acquisition: which sources are growing vs. declining?
Top content: which pages gained or lost traffic?
Conversions: how many conversions from each traffic source?
Engagement: what is the engagement rate trend?
Action: what one marketing activity will I prioritize based on this data?
Conclusion
Google Analytics is only useful if you act on what it tells you. The data becomes transformative when you stop looking at it passively and start asking specific questions: 'Why did traffic drop in March? Which content generates the most leads? Where are people dropping off in my
Learn More...............https://techmkit.com/blog